By DJ Swan, Fugro Roadware
Can you prove that pavement management works for your network?
Most people reading this are involved in the development and implementation of pavement management. Which means that you understand that pavement management isn’t just done to meet reporting requirements for funding, but because pavement management works. The cost savings and/or performance improvements resulting from data-driven network-level decisions are expected to be several times more than the cost of collecting performance data, as shown in the figure below.
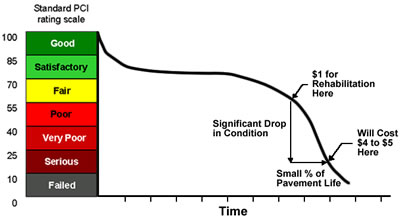
Source: PAVER Website (http://www.paver.colostate.edu/)
However, many agencies still face significant doubt regarding the network-level recommendations and long-term performance predictions. This doubt often comes up as many people, including senior management, aren’t able to quantify the improvement to the network or the equivalent dollars saved. District staff find that the recommendations don’t always match their expectations and a detailed design process recommends very different treatments.
Quantify the Benefit
My experience has shown that very few agencies have gone through the effort of determining what the return on investment actually is for their pavement management process. Since pavement management tracks both the existing condition as well as the projects and cost to complete past work, this sounds like the ROI calculation would be easy to complete.
Most agencies struggle with comparing the effectiveness of their recommended treatment selection to that of not using a PMS in maximizing performance and/or minimizing costs. This can be a problem because some agencies have been using pavement management so long, they no longer have the benchmark of how effective their decision making was before.
It is possible to evaluate what the five year performance would look like if non-optimal projects were selected. For example, using a worst-first priority for treatment selection will show what the difference in network performance would be like. This comparison maybe a little extreme over the use of engineering judgement when applying preventative maintenance, but the results will show a realistic range for how much improvement has been achieved. This improvement can be quantified in terms of equivalent dollars saved per year to demonstrate the benefit of a data-driven decision making to senior management.
Ensuring that Recommendations are Worth Implementing
Each year, the rehabilitation activities completed the previous year are received by the pavement management group and entered into the system. Does your agency review the list of what was completed and compare it to what was recommended? There is a lot to learn from understanding how treatment recommendations are changed and how the list of completed sections may differ from original recommendations.
Many agencies find themselves making different decisions at the detailed design stage as compared to the network-level optimization. When this frequently occurs it is important to ask how the recommendations differ and what information, if available for the pavement management system, would have led to a more practical decision. Often times the detailed designs involves the review of the more detailed construction history, the in-situ materials, the traffic predictions, and additional structural testing. These may not be used in great detail on the network-level predictions, but project review can help improve the assumptions and make these decisions better align.
Difference in sections selected by district staff can also indicate information that may not be available. If other information regarding other assets, local developments, or political importance is available, this can also be used. It is important to capture differences due to conditions known by local staff, such as materials problems or structural inadequacy that are not measured in the annual data collection efforts.
What Information Should be Collected?
Pavement management can be completed for many agencies with very limited information. The simplest form may be done with just inventory, construction history, and typical activity life. However, the quality of the predictions will clearly reflect the quality of the inputs.
Most agencies are at least using roughness and distress data, collected every year or two, to understand the current conditions. This data is used to show the functional deterioration of the road surface over time and to understand current conditions without estimates. The data also allows a better recommendation of what type of treatment will address the problems observed in the field. Most people will believe that this will have a significant return on investment. But can you prove it?
How would your decisions have been different if you used only distress or roughness? Would you be more likely to rehabilitate a road too early or too late? How much more would it cost to fix a road that fails prematurely because the root cause of the problem was not identified? The reverse of this problem is how much could have been saved by doing a less expensive treatment if you knew the true cause? Each of these questions individually, can be answered.
Demonstrating the improvement will help show if you have enough information. It can also show how much better the performance of the network could be if you had more confidence in your existing results or if you had additional information. I think you will find that the cost of additional data looks insignificant as compared to the cost of a 10 mile road with a mill and overlay that lasts only half as long as expected.
For more information, please contact DJ Swan at djswan@fugro.com