Part II: For Performance Management, is IRI a Better Indicator?

By Sui Tan, Metropolitan Transportation Commission (MTC)

In my previous blog, I talked about why IRI contributes little to reduction of deferred maintenance from the asset management perspective. I will now continue to discuss if IRI will be a better performance indicator in pavement preservation, since pavement preservation is one of the national goals in the Moving Ahead for Progress in the 21st Century (MAP-21) act.


Pavement Preservation

From the engineering perspective, at the time of construction, the asphalt cement starts to age-harden.  As it hardens, the asphalt cement and asphalt concrete loses its ability to expand or stretch without cracking.  So after some time cracks start developing, which leads to further cracking and decrease in condition index, as shown in the graphs below. IRI stays relevantly constant through much of this, but as the cracking increases and the condition index deteriorates, the IRI starts to increase.  However, by the time the IRI has increased significantly, the cracking may have caused significant structural deterioration in the pavement – well beyond what preventive maintenance treatments included in a pavement preservation program can address.  So while IRI can be used to identify pavements that are beyond the point where most preservation treatments can be applied, it does little to identify when to apply preservation treatments.

STan_Fig1


Performance Management Indicator

In performance management, there are “leading” and “lagging” indicators. A lagging indicator is usually easy to measure but hard to influence. An example is using weight loss as a goal. You step on a scale and you know your weight. However, the weight is a lagging indicator. It is too late when the scale says you are 10 pounds overweight. So how do you reach your goal? Leading indicators like the amount of calories intake and burned will be good ones to start with.

In pavement management, IRI measures ride quality or smoothness of pavement. It is easy to measure and is used by all state highway agencies for the Highway Performance Monitoring System (HPMS) reporting. However, the IRI increase is only noticeable when certain amounts of distresses have appeared, and is less sensitive to cracking distresses. Hence, when it comes to pavement preservation, IRI is a lagging indicator for preventive maintenance. On the other hand, for example, PCI based on ASTM D6433 standard, is an excellent leading indicator, enabling an agency to apply preventive maintenance when the first sign of distress appears. This is because pavement rating for PCI is based on low, medium, and high severity of various distresses and their quantity.


For more information, contact Sui Tan at:   stan@mtc.ca.gov

Using LCCA as a Pavement Management Performance Measure

Prepared by David Luhr, Washington State Department of Transportation (WSDOT)

In the Moving Ahead for Progress in the 21st Century (MAP-21) text, there is a Declaration of Policy [Title 23, Sec. 150, paragraph (a)] that states: “Performance management will transform the Federal-aid highway program and provide a means to the most efficient investment of Federal transportation funds …”.  Yet, in the proposed MAP-21 pavement performance measures (Notice of Proposed Rule Making), there is no mention of pavement costs or the concept of monitoring the “efficient investment of Federal transportation funds”.  This article proposes a special application of Life-Cycle Cost Analysis (LCCA) as a tool in making decisions and monitoring the cost-effectiveness of pavement management.

Calculating the LCCA of pavement assets has been performed since the early days of pavement management.  Traditionally the LCCA has been used to evaluate different pavement design alternatives in order to select a long-term strategy.  The figure below is taken from the FHWA publication titled “Life-Cycle Cost Analysis in Pavement Design” (publication FHWA-SA-98-079)

Luhr_Fig1

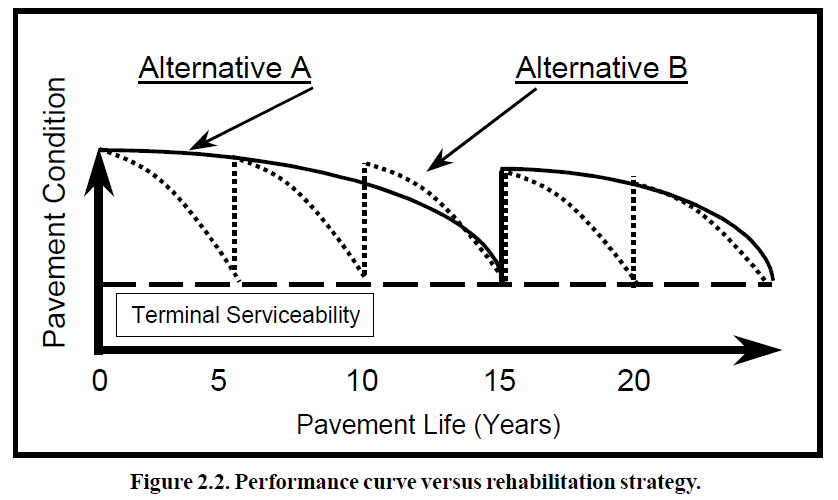
This figure illustrates the choice between two alternatives; one that is designed for long performance periods (15 years), and one that is designed for shorter periods (5 years).  We would typically determine the LCCA for each alternative and use this information to select a design strategy.  We can call this the Strategic LCCA.

The Strategic LCCA is estimated to make decisions for pavement type selection, and long-term pavement strategies.  However, there are few new alignments being designed and built today, and reconstruction is infrequent because of a concerted effort at most agencies to preserve the pavement structure and avoid reconstruction.

A far more common situation is the year-to-year decisions that are made regarding the maintenance, preservation, and resurfacing treatments for a given section of roadway.  These decisions are made based on the conditions in a specific performance period.  The rate of pavement deterioration, the maintenance treatments appropriate for the pavement condition, the timing of the eventual rehabilitation, the costs incurred, are all part of a single performance period evaluation.

The actual costs incurred from construction, maintenance and preservation (we can call this the Actual LCCA) can be compared with observed pavement performance to evaluate how cost-effective the actual performance has been, and compare with the Strategic LCCA.  It will turn out that the Actual LCCA will be more important than the Strategic LCCA, since the actual conditions will be used to determine the best pavement management decisions.

LCCA is typically expressed in terms of Equivalent Uniform Annual Cost (EUAC), or Net Present Value (NPV).  When evaluating the cost-effectiveness of pavement management there are significant advantages to characterize the life-cycle costs in terms of EUAC rather than NPV.  The NPV expresses the total cost only, but the EUAC relates cost to a period of time, which is very useful for expressing cost-effectiveness.  For example,

  • the EUAC is a simple value that can be directly compared with the annual cost of a different project, or with average annual costs statewide,
  • the EUAC is easier to calculate, since the time periods comparing alternatives can be different (no need to use multiple performance periods to compare exactly the same number of years like NPV), and
  • when using EUAC, there is no need to consider Salvage Value. In practice, pavements are not salvaged at the end of service life, but are typically rehabilitated for a new performance period.

The figure below shows the Actual EUAC over time for an example Performance Period (defined as the period of time between two pavement rehabilitation projects).  As the years progress the annual costs decline as we are spreading the costs over more years.  As the pavement gets older, maintenance and preservation costs increase, which can also be calculated in terms of EUAC, and added to the construction costs to get a plot of Total Annual Cost over time.

At some point in time the maintenance costs will increase to the point that the Total EUAC begins to increase.  In Decision Analysis methods (specifically Replacement Analysis) the lowest point on the Actual EUAC curve is the optimum time to rehabilitate the current pavement structure.  At Washington State DOT (WSDOT), we evaluate the Actual EUAC when a pavement is proposed for rehabilitation, and compare with the change in Annual Cost expected with additional preservation treatments.  Often, the preservation treatment will result in a lower Annual Cost, so the pavement rehabilitation project will be delayed.  The important thing to note in these evaluations is that we are using Actual EUAC, based on actual costs and observed performance for a particular segment of road.  This provides us the best information to evaluate and make important decisions.  Even a difference in timing of one year can make a difference. WSDOT experience has shown that a one year change in the year of resurfacing can make a 14% – 20% difference in project cost for chip seals, and 4% – 8% difference for asphalt concrete resurfacing projects.

Luhr_Fig2

The evaluation of the Actual EUAC (expressed as $/lane-mile/year) of pavement management decisions becomes a valuable performance management tool in answering these questions:

  • How much has it cost to deliver pavement functionality on the road network?
  • What are the most cost-effective pavement management practices?
  • Has the investment in the pavement infrastructure been adequate for long term sustainability?
  • How well are the pavement assets being managed?

Having answers to these questions is essential for pavement asset management.  The costs will obviously be a factor dependent on site conditions and traffic, but for any set of site conditions an agency should have a method for tracking the cost-effectiveness of pavement management decisions.


The topic of pavement economics was further explored in a paper titled “Economic Evaluation of Pavement Management Decisions,” presented at the ICMPA9 conference. For more information, contact David Luhr at Luhrd@wsdot.wa.gov


Highlights from the Ninth International Conference on Managing Pavement Assets: Focus on the Key-Note Addresses

Prepared by Judith Corley-Lay, North Carolina Department of Transportation (NCDOT)

The ICMPA9 conference was held in Alexandria, Virginia and included three concurrent sessions with 3 to 4 papers in each. The breakout sessions included topics on Innovation, performance curves, measurements and instrumentation, visualization, data quality, decision making, airports, local roads, public private partnerships, and many case studies. 338 attendees participated, including enough members of AFD10 to hold a mid-year meeting.

 
In this blog, I want to focus on the keynote addresses. Katie Zimmerman provided the perfect opening to the conference by describing the “story of pavement management” in chapters. Chapter 1 began with the AASHO road test and the early pavement management systems. Chapter 2 was marked with technological advances that led to today’s more advanced systems. We are living in Chapter 3, with significant improvements in technology (laser sensors, high definition imaging and greatly expanded computing capabilities) that have automated much of our data collection and processing. In the midst of this richness of technology, we face a reduction in funding and concern about the long-term viability of our systems. And of course, Chapter 4 is the future, with its challenges and opportunities. We are looking to a future where asset management and pavement management are essential to preserve or improve system conditions.

 
Dr. Sam Savage, author of “The Flaw of Averages” gave an invited lecture demonstrating the risk that is inherent if we base our decisions on average values. He showed some interesting Monte Carlo simulation capabilities available in Excel that can be used to better describe risk for pavement decision making. In many presentations after this presentation, authors would apologize for the use of “averages” in their papers, so Sam’s presentation successfully displayed the issue.

 
Andre Molenaar presented the final keynote address on Thursday afternoon and it was a fitting way to close the conference. His presentation focused on building in quality during design and construction so that asset performance is better controlled. He also tied building quality into the concept of sustainable pavements. Of particular interest was using construction demolition waste in base layers to minimize material sent to landfills. This concept is used in the Netherlands, where 95% of the construction demolition waste is recycled into road base and sub-base.

 
I will close with a few favorite quotes from the conference:
Good judgement comes from bad experiences.
Perfect is the enemy of good.


For more information, contact Judith Corley-Lay at: jlay@ncdot.gov

For Performance Management, is IRI a Better Indicator?

By Sui Tan, Metropolitan Transportation Commission (MTC)

The recent MAP-21, FHWA’s Notice of Proposed Rule Makings (NPRM) have heightened the importance of IRI as one of the performance metrics on pavement conditions that is required in the state DOT’s asset management plan. Why would FHWA pick IRI? For one important reason – this is by far the only national-level data that the state DOTs collect and submit every year for Highway Performance Monitoring System (HPMS) reporting. Many state DOTs have IRI data since 1990 when it was first required by FHWA. So it is reasonable to see why the IRI became one of the performance metrics proposed, and state DOTs will be required to set a target in their asset management plan.


Asset Management Plan

FHWA’s NPRM on asset management plan requires state DOTs to establish an asset management plan “to improve or preserve the condition of the assets and the performance” of pavement and bridge assets. This plan shall include, at a minimum, objectives and measures, performance gap identification, life-cycle cost and risk management analysis, and a financial plan with investment strategies. [23 U.S.C. 119(e)(4)].

How exactly will IRI be used in the state’s asset management plan? What is the target to set? FHWA has proposed a minimum of no more than five percent of poor condition, and further identified poor is IRI of 170 inches/mile in area with population fewer than one million and 220 inches/mile in area with population greater than one million. Many state DOTs, including AASHTO, have commented that managing by minimum condition will lead to “worst first” approach.  AASHTO further indicates that ”to use such limited data mined from the HPMS database to establish correlations between system performance and investment decisions is not recommended.”

So I am going to be bold and assume that every state DOT is facing inadequate funding to sustain its pavement asset investment, and hence has accumulated deferred maintenance. To achieve the “state of good repair”, there has to be a way to effectively measure the effort on reducing the deferred maintenance costs. Fortunately, FHWA has already defined the minimum components to be included in an asset management plan as stated earlier. To put it in more of a layman’s terms, the plan will include asset inventory, condition assessment, maintenance and rehabilitation strategies, and proposed plans to achieve the state of good repair. While these components do not directly address contributors to the accumulation of deferred maintenance, if implemented effectively, they could provide a “strategic and systematic” approach to assist DOTs in prioritizing maintenance efforts and benchmarking performance, and provide Congress the data needed to work out long-term funding solutions.

My point is, from an asset management approach, IRI so far has not directly correlated to the reduction of deferred maintenance. My next blog will continue to explore other factors when considering if IRI is a better indicator as a MAP-21 performance metric.


For more information contact Sui Tan at:   stan@mtc.ca.gov