NCHRP Synthesis 501 on Pavement Management Systems

By Katie Zimmerman, Executive Vice President, Applied Pavement Technology

Have you ever wondered how your pavement management system compares to the systems in other agencies? Here’s an opportunity to find out! NCHRP just recently published a synthesis of pavement management practices in state and provincial transportation agencies. The synthesis documents recent changes in pavement management and explores current practices in using pavement management results for activities such as resource allocation, determining treatment cost-effectiveness, program development, and stakeholder outreach. Case examples showing innovative uses of pavement management data from the Kansas, Maryland, North Carolina, Texas, and Washington DOTs are also included.

The synthesis is available here: http://www.trb.org/main/blurbs/175607.aspx or here: https://www.nap.edu/download/24682

Challenges with Linear Referencing Systems (LRS) and Future Directions

By Magdy Mikhail, Texas Department of Transportation


TxDOT Reference Marker (TRM) system provides a method of tracking pavement condition data for the past, present and the future.  The TRM is used for all state-maintained highway network including: Interstate, US highways, State Highways (SH), Farm to Market (FM) roadways and also state-maintained toll roads.

TxDOT derives Reference marker numbers by imposing a grid on a map of Texas. Grid axes are set on extreme western and northern points, where numbering begins with ten. The first reference marker numbers match approximate grid locations. Subsequent marker numbers increase by two. Numbers increase north to south and west to east, depending on the highway’s general direction (except north‑south interstates, where numbers increase south to north). The numbers are continuous from beginning to end across the state and do not start over at county lines.  Reference markers are used to determine the locations on the highway network.  Figure 1 shows an example of a reference marker on a highway.

magdy_10312016

Figure 1.  Numbering Scheme for Reference Markers.


The accuracy of reference marker locations is important for the quality of the pavement data collection and also for identifying accident locations.

Operators of pavement testing equipment often encounter a variety of problems during data collection.  The reference markers are not consistent from one year to another.  The locations may change and installed in the wrong location.  The order of reference markers of whether ascending or descending changes from year to year especially for loops.  The accuracy of reference markers locations can vary from 0.1 mile up to a mile or more.  In some cases the coordinates of the reference markers are missing.  Currently the reference markers are based on center line measurements which vary from the outside lane measurement due to curvature and alignment.  Another challenge is that some markers may plot outside the road limits, when using GPS coordinates to map reference markers to aid with planning for data collection .

Geographic information systems (GIS) use a coordinate system to define the location of each feature of the network.  Connecting relationships between feature coordinates define the routes or branches.  The layout of the pavement network can be completely defined with the coordinate system.  The use of beginning Distance From Origin (DFO) and ending DFO eliminate most of the problems encountered with linear measurements from a reference point.

The new pavement management systems need to be able to handle multiple referencing systems to evaluate attributes for pavement assets.


For more information, please contact Magdy Mikhail at <Magdy.Mikhail@txdot.gov>

Pavement Warranty Program in Mississippi

by Cindy Smith, Assistant State Research Engineer, Mississippi DOT

and Dr. Feng Wang, Associate Professor, Jackson State University


The Mississippi Department of Transportation (MDOT) began using pavement warranties in 2000 and has awarded approximately 21 warranty projects since then.  Four of these are still under a warranty period.  Most (18) were asphalt, and 3 were jointed concrete pavements.  Jackson State University (Wang, Qi, El-Gendy, et al.) did a previous research study, published in 2012, on MDOT’s warranty program.  Among the findings of this study were the following:

  • Potential benefits of implementing pavement warranty include decreased construction oversight, enhanced pavement quality, flexibility in pavement type and material selection, and the potential for the industry to use its knowledge more productively, primarily because of the shift from a passive to an active attitude toward quality.
  • The analytical results show that the performance of the warranty pavements is significantly better than that of the non-warranty pavements at the same service time level, and warranty pavements can maintain at high service levels for a longer time than non-warranty pavements.
  • While MDOT’s warranty program helps pavement performance, it is suggested that direct measurements of pavement distresses or distress densities be used as distress thresholds, and consistent threshold levels be implemented for all distress types.


This report can be found at the following link:

http://mdot.ms.gov/documents/research/Reports/Interim%20and%20Final%20Reports/State%20Study%20221%20-%20Evaluation%20of%20MDOT%27s%20Distress%20Thresholds%20for%20Maintained%20Pavement%20Projects.pdf


With this recommendation in mind, MDOT is contracting again with Jackson State University to refine the thresholds.  The following are reasons for this study:

  • MDOT uses deduct points calculated from distress quantities and severities, rather than the distress quantities and severities themselves or distress densities. These deduct points were originally developed as part of a composite index calculation in network-level collection.
  • Up until the 2010 biannual pavement condition survey, MDOT analyzed distresses on two 500-ft samples per mile. Since 2010, MDOT has had the data collection vendors collect the entire lane using 100% automated collection methods.  However, MDOT continued to use manual rating and sampling on the in-house-collected warranty projects since this was better suited to project-level rating and since most warranty contracts were in place prior to 2010.
  • Most states with warranty projects use distress thresholds rather than deduct points. The use of thresholds or densities would be easier and more straightforward for contractors and MDOT than deduct points.
  • Currently, roughness is not used for warranty performance standards. In recent years, MDOT has begun using Mean Roughness Index (MRI) for construction acceptance.  We would like to investigate the possibility of using MRI in warranty projects as well.


The JSU/MDOT study will take two years and will include tasks of developing statistical models and new distress thresholds, as well as validation and documentation of these.  Both MDOT and JSU look forward to refining, streamlining, and updating Mississippi’s warranty project process.


for more information, please contact Cindy Smith at  cjsmith@mdot.ms.gov

3 Cold Hard Truths on Condition Assessment

by Sui Tan, Metropolitan Transportation Commission (MTC)

I received an urgent phone call from an East Coast user few days ago. “You have to help me!” Before I could say “sure”, he had started telling me the problem. In short, he was asking if there was anything he could do to rectify the distress data that were collected a year ago. This is because without any increase in funding, his network PCI had gone up 10 points.

TRUTH #1: Garbage in, garbage out. The fact is, you can’t hide the truth about your pavement condition. It is just a matter of time before people find out. If there are poor pavements, the motoring public will find out first. Besides pavement condition, treatment selection in StreetSaver is triggered by PCI. If the PCI is in error, then wrong treatment will be recommended. This will result in unrealistic maintenance needs assessment. You see the domino effects. I have heard many horror stories from local agencies and consultants on pavement condition surveys. The worst enemy of a pavement management program is “I don’t trust the data.”

TRUTH #2: If it is not documented, it didn’t happen. Since MTC also hires data collection vendors under our Pavement Technical Assistance Program (PTAP), it is important to make sure that quality data is being collected by our consultants. The quality standards are documented in the MTC Data Quality Management Plan. This plan specifies how to pre-qualify consultants before accepting their proposals, quality control before, during, and after production, and data acceptance procedures to validate consultant’s results meet established quality standards. If you are investing thousands of dollars in condition assessment, then it pays to establish a data quality management plan. It doesn’t have to be like a 100-page manual, just a few pages will suffice. Some agencies have adopted or modified MTC’s version. Or you can refer to the Practical Guide for Quality Management of Pavement Condition Data Collection by FHWA. Remember, if it is not documented, it didn’t happen.

TRUTH#3: Hire qualified consultant. I am often asked to provide samples of request for proposal/qualification from MTC and other local agencies. In reviewing their initial proposal, one of my biggest pet peeves is on hiring low bidder. I always advise local agencies not to rely solely on price. To help our users hire qualified consultants, MTC routinely tests data collection vendors and their pavement raters under the Rater Certification Program as part of the MTC Data Quality Management Plan.

To finish up the opening story, the user ended up paying another qualified consultant to do the condition assessment again. Ouch!

streetsaver-pavement-rating

for more information, please contact Sui Tan at stan@mtc.ca.gov

The First World Conference on Pavement and Asset Management WCPAM2017 , June 12-16, 2017, Italy

Announcement and Call for abstract (deadline March 13, 2016)

wcpam1

Pushing the evolution of transportation infrastructures: let’s shape the future of pavement and asset management!

The European Pavement and Asset Management Conference (EPAM) and the International Conference on Managing Pavement Assets (ICMPA) are joining forces for the World Conference on Pavement and Asset Management WCPAM2017 which will be held in Italy from 12 to 16 June 2017. The event will take place in the enchanting lakeside town of Baveno, on the amazing Maggiore Lake, at short distance from Milano Malpensa international airport.

Politecnico di Milano, the leading Italian Technical University in Architecture, Design and Engineering, is especially honored to be hosting this Conference. The Conference is intended not only for academics and researchers, but looks also at practitioners, companies, authorities, associations, engineers and technicians dealing with everyday tasks and responsibilities related to transport infrastructures, pavement and asset management, in particular.”, stated Maurizio Crispino, Chairman of the Conference and Full Professor of the Department of Civil and Environmental Engineering at Politecnico di Milano (Italy).

The topics of the Conference include road and airport pavements and other assets:

  • maintenance, preservation and rehabilitation activities;
  • Pavement Management Systems;
  • data monitoring and performance assessment;
  • economic, environmental and political strategies;
  • life-cycle cost analysis and life-cycle assessment;
  • safety and risk management;
  • innovative design methods and materials;
  • smart infrastructures and Intelligent Transportation Systems;
  • bridge and tunnel pavements.

The conference includes an extensive technical program: parallel podium/poster sessions, technical tours, tutorials, plenary sessions with presentations by leaders in the field of pavement engineering, young professional and student events, exhibits of international companies driving innovation and quality in pavement engineering, construction and maintenance techniques.

The Call for abstract is now open!

Please, submit your abstract before 13th March 2016 by following the conference website instructions at www.wcpam2017.com. The abstract should be at most 250 words, and it must clearly state the purpose, the methodology and the significance of the work. The conference proceedings will possibly be indexed by major databases, such as SCOPUS.

wcpam2

For more information regarding the conference or sponsorship opportunities and benefits, please visit the website www.wcpam2017.com

or contact the organizing committee at wcpam2017@wcpam2017.com (segreteria@studioesse.net for Sponsorship & Exhibition packages).

Brochure


Article written by WCPAM2017 Organizing Committee

An invitation to participate in the World Conference on Pavement and Asset Management, WCPAM2017

With the Transportation Research Board (TRB) 95th Annual Meeting behind us, it’s time to focus on the future a little bit.

The Annual Meeting always leaves a strong feeling – besides bewilderment, particularly if it’s your first time.  For me this feeling is a sense of urgency.  This comes from a sense that the state of knowledge in our field is advancing rapidly and that there are too many innovations to take stock of and implement in the time I have available between Annual Meetings. Nevertheless, I also find an underlying optimism in thinking that if we (continue to) share our experiences and advances, we can bring the state of the practice forward.

But let me get back to the sense of urgency for a moment. Our next international conference, which has been named “WCPAM2017” (World Conference on Pavement and Asset Management 2017), will take place in June of next year. And working the calendar back to the present, there is but a short window of time in which to prepare abstracts to submit for consideration. The deadline – March 13, 2016 – is only about five weeks away.

One of the unique features of this conference is that it represents the coming together of two groups that work on pavement and asset management but which do not normally have many chances to carry on a fluid conversation about advances in our field: The European Pavement and Asset Management (EPAM) group and the international community that gathers around the TRB North American and international activities.

So I urge all of you – all of us – to consider sharing innovations, approaches to solving pavement management problems, in short, to seriously think about submitting an abstract to WCPAM2017. The opportunity for exchange is unparalleled and each group will benefit from learning about activities of the other.

Instructions and conference information are all available at http://www.wcpam2017.com.


Look forward to your participation!


Sincerely

Ed

Edgardo D. Block

Chair, TRB Standing Committee on Pavement Management Systems (AFD10)

Two Post Scripts:

First, if the above is not sufficient incentive to submit an abstract, please consider the conference venue as an opportunity to do all the knowledge exchange in a one-of-a-kind location. Look at the Conference -> Venue tab on the conference web site to see.  Or simply search for “Baveno, Italy” on any image site on the internet.

Second, this unique gathering of pavement and asset management professionals presents a unique opportunity for exhibitors. There is information at www.wcpam2017.com on how to participate as an exhibitor as well.

International Focus: Data is Key to Success – The Thirty Year New Zealand Infrastructure Plan 2015

By Dr Seosamh Costello, The University of Auckland

The New Zealand Government recently released its Thirty Year Infrastructure Plan, through Treasury’s National Infrastructure Unit. The vision, by 2045, is to have infrastructure that is resilient and coordinated, and contributes to a strong economy and high living standards. Although the plan includes most national infrastructure assets, to provide some context for this forum, the highway component of the nation’s infrastructure comprises of almost 11,000 km of state highway network and almost 84,000 km of local roads.

The identified challenges over the next thirty years include aging assets and infrastructure networks, affordability constraints, productivity gaps, climate change and availability of natural resources, among others. The response to these challenges will require a step change in how New Zealand approaches infrastructure. Of interest to this forum is the fact that one of the three key responses is ‘Strengthening Asset Management’.

The specific actions which are set to anchor this strengthening of asset management are:

  • Develop metadata standards for roads, buildings and water infrastructure
  • Establish regional centres of excellence or similar arrangements for collating and making available the data obtained through shared metadata standards.

Clearly, therefore, the government see data availability as one of the keys to the success of the infrastructure plan. I will go one step further and say that its success relies not just on the data itself but how this data can be converted into useful information to support more effective and efficient decision making.


For more information, please contact Dr Seosamh Costello at s.costello@auckland.ac.nz or read the full document at http://www.infrastructure.govt.nz/plan/2015/


The Return on Investment in Implementation of a Pavement Management System

By DJ Swan, Fugro Roadware


Can you prove that pavement management works for your network?

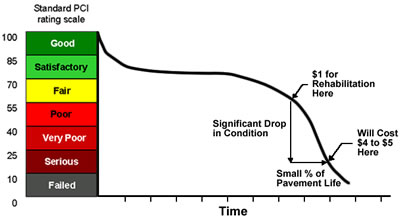
Most people reading this are involved in the development and implementation of pavement management. Which means that you understand that pavement management isn’t just done to meet reporting requirements for funding, but because pavement management works. The cost savings and/or performance improvements resulting from data-driven network-level decisions are expected to be several times more than the cost of collecting performance data, as shown in the figure below.
djpic

Source:  PAVER Website (http://www.paver.colostate.edu/)

However, many agencies still face significant doubt regarding the network-level recommendations and long-term performance predictions. This doubt often comes up as many people, including senior management, aren’t able to quantify the improvement to the network or the equivalent dollars saved. District staff find that the recommendations don’t always match their expectations and a detailed design process recommends very different treatments.


Quantify the Benefit

My experience has shown that very few agencies have gone through the effort of determining what the return on investment actually is for their pavement management process. Since pavement management tracks both the existing condition as well as the projects and cost to complete past work, this sounds like the ROI calculation would be easy to complete.

Most agencies struggle with comparing the effectiveness of their recommended treatment selection to that of not using a PMS in maximizing performance and/or minimizing costs. This can be a problem because some agencies have been using pavement management so long, they no longer have the benchmark of how effective their decision making was before.

It is possible to evaluate what the five year performance would look like if non-optimal projects were selected. For example, using a worst-first priority for treatment selection will show what the difference in network performance would be like. This comparison maybe a little extreme over the use of engineering judgement when applying preventative maintenance, but the results will show a realistic range for how much improvement has been achieved. This improvement can be quantified in terms of equivalent dollars saved per year to demonstrate the benefit of a data-driven decision making to senior management.


Ensuring that Recommendations are Worth Implementing

Each year, the rehabilitation activities completed the previous year are received by the pavement management group and entered into the system. Does your agency review the list of what was completed and compare it to what was recommended? There is a lot to learn from understanding how treatment recommendations are changed and how the list of completed sections may differ from original recommendations.

Many agencies find themselves making different decisions at the detailed design stage as compared to the network-level optimization. When this frequently occurs it is important to ask how the recommendations differ and what information, if available for the pavement management system, would have led to a more practical decision. Often times the detailed designs involves the review of the more detailed construction history, the in-situ materials, the traffic predictions, and additional structural testing. These may not be used in great detail on the network-level predictions, but project review can help improve the assumptions and make these decisions better align.

Difference in sections selected by district staff can also indicate information that may not be available. If other information regarding other assets, local developments, or political importance is available, this can also be used. It is important to capture differences due to conditions known by local staff, such as materials problems or structural inadequacy that are not measured in the annual data collection efforts.


What Information Should be Collected?

Pavement management can be completed for many agencies with very limited information. The simplest form may be done with just inventory, construction history, and typical activity life. However, the quality of the predictions will clearly reflect the quality of the inputs.

Most agencies are at least using roughness and distress data, collected every year or two, to understand the current conditions. This data is used to show the functional deterioration of the road surface over time and to understand current conditions without estimates. The data also allows a better recommendation of what type of treatment will address the problems observed in the field. Most people will believe that this will have a significant return on investment. But can you prove it?

How would your decisions have been different if you used only distress or roughness? Would you be more likely to rehabilitate a road too early or too late? How much more would it cost to fix a road that fails prematurely because the root cause of the problem was not identified? The reverse of this problem is how much could have been saved by doing a less expensive treatment if you knew the true cause? Each of these questions individually, can be answered.

Demonstrating the improvement will help show if you have enough information. It can also show how much better the performance of the network could be if you had more confidence in your existing results or if you had additional information. I think you will find that the cost of additional data looks insignificant as compared to the cost of a 10 mile road with a mill and overlay that lasts only half as long as expected.


For more information, please contact DJ Swan at djswan@fugro.com

Network-Level Pavement Structural Condition Evaluation Needs

By Jerry Daleiden, Fugro Roadware

Agencies are continually being challenged to “do more with less”.  Improvements in pavement management and pavement preservation have aided in this process.  In the process of continuous improvement, it has been recognized that many agencies are still struggling with limitations in available technology to capture the network level in-situ pavement structural condition in a non-destructive and practical manner. Currently, the most commonly used device for network level pavement structural evaluation is the falling weight deflectometer (FWD).  FWD testing requires traffic control, which is costly and impractical for continuous pavement evaluation. Therefore, FWD testing is focused more on project level evaluations or performed at infrequent sampling intervals, at best.

With the introduction of equipment to fill this void and conduct structural evaluation of a pavement network continuously and non-destructively at reasonably high traffic speeds, concerns have been raised about the analysis of this data, how it compares to other structural capacity data and how to appropriately include such information in existing pavement management practices. Projects have been conducted to assess, evaluate and develop analysis methodologies for structural condition indicators.  A pooled fund study is also underway to demonstrate the equipment’s use.  With these initiatives the focus is gradually shifting to how to incorporate such information in the pavement management decisions process.

Continued efforts are being pursued to aid in applying the findings from research completed in the US and efforts elsewhere (United Kingdom, Australia, South Africa, Poland, and others) to maintain the momentum of incorporating structural capacity in the pavement management decision process. Few have argued that structural capacity is not needed to enhance PM decisions, but perhaps, for some, the numbers may still need to be evaluated to clearly confirm the value added clearly outweighs the cost.  Historically (and practically) speaking though, without conducting network level evaluations utilizing the technology to gain more experience, it is difficult to optimize the data collection process (as has been done with other pavement data collection), developing data collection guidelines and quality control procedures.  Only then can we truly evaluate the full potential and value for inclusion of such data in our decision making processes.


For more information, please contact Jerry Daleiden at jdaleiden@fugro.com

Describing Your Pavement Network in One Sentence

By Tim Rydholm, Washington State Department of Transportation

You just have received an email from your agency’s Asset Management Office.  They have been told their asset management documentation is way too complex and now each asset management group must come up with one sentence per type of asset that describes the scope and resources it takes to manage it.  Moreover, it’s a fill-in-the-blank sentence:

Our agency has (x number) of (asset y) worth ($z dollars) and requiring $(a dollars) per year to preserve.

Your task is to fill-in-the-blanks for pavements at your agency.

For the Washington State DOT (WSDOT) pavements, this is how blanks would be filled in: WSDOT has around 18,500 lane miles of pavement worth $16 billion and requiring $250 million per year to preserve.  This information is contained in the most recent December edition of WSDOT’s Gray Notebook.

As a pavement asset manager, you probably have some follow up questions.  Does the lane mile total include ramps?  No.  Does WSDOT manage county roads? No, unlike some states, county and city roads are managed locally.  What is the Annual Vehicle Miles Traveled (AVMT) for these pavements? In 2014, it was 32.17 billion. What’s included in the costs?  At WSDOT we include all project costs including traffic control and engineering.  Was depreciation or the value of the right of way used in estimating pavement worth?  No.  The $16B value only includes the replacement (reconstruction) of the pavement in like-kind and excludes bridges, land value, lighting and guardrails.

And the most complex follow up question – how was $250 million calculated as the annual amount needed to preserve the pavement system?  The level of complexity going into this type of analysis may vary.  In this case, a “back of the napkin” type of calculation is sufficient (at least as a starting point).  For WSDOT, pavements can be divided into 3 broad categories: Low to Medium Traffic, Medium to High Traffic, and High Traffic/Special Circumstance.  Each of these categories lends itself to a specific preservation strategy: Chip Seal resurfacing, Asphalt resurfacing and Concrete, respectively.  Using average cost and life information, the back-of-the-napkin calculation can be done:

Asphalt Chip Seal Concrete
Avg. Life 16 Years 8 Years 50 Years
Avg. Cost per Lane Mile $200,000 $40,000 $2,500,000
Applicable Lane Miles 9,250 7,250 2,000
Avg. Annual Cost $115 M $35 M $100 M
Total Annual Cost: $250 M

The numbers in the above table are rough averages that have been specifically rounded to make a “neat” number for communication.  Our Pavement Management Office has done several more in-depth analyses for network lowest life cycle cost that produce ranges of average annual need between $225 M and $275 M, but for the purposes of communication and planning $250 million is very useful as the benchmark for sufficient funding for pavement preservation.

I think a lot can be learned just by completing this fill-in-the-blank exercise.  Can you fill in the blanks for your agency?  Are you willing to share in the comments?  Do you have other questions or considerations that may go into such an answer – or can you think of a better sentence that describes the scope and cost of your pavement assets?


For more information, please contact Tim Rydholm at: rydholt@wsdot.wa.gov